Ingress Traffic Monitoring with Prometheus
Using Higress Console’s Built-in Monitoring Suite
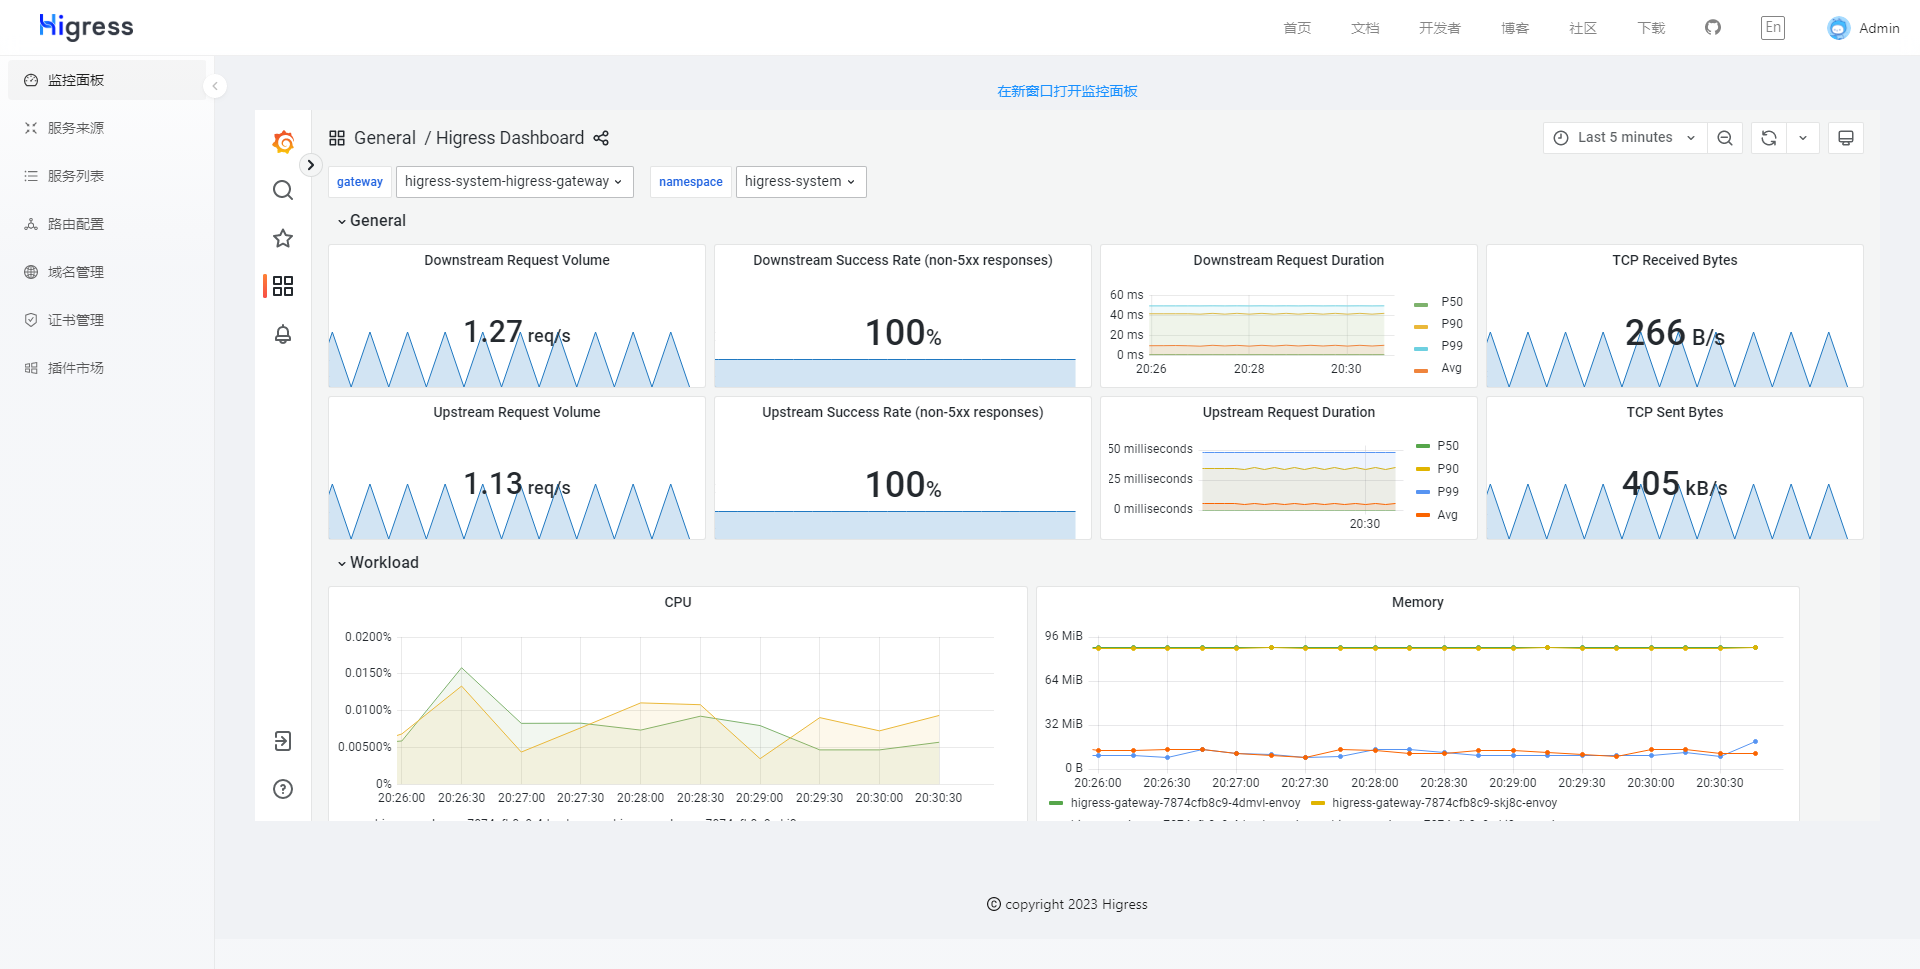
Section titled “Using Higress Console’s Built-in Monitoring Suite”Higress Console includes a built-in monitoring suite based on Prometheus + Grafana, though it’s not installed by default. To enable this monitoring suite during Helm installation, add the --set global.o11y.enabled=true parameter to your Helm install command:
helm repo add higress.io https://higress.io/helm-chartshelm install higress -n higress-system higress.io/higress --create-namespace --render-subchart-notes --set global.o11y.enabled=trueAfter installation is complete, access the Higress Console in your browser and click on the “Monitoring Dashboard” in the left navigation menu. The built-in monitoring dashboard will be displayed on the right side of the page.
Using an Independently Deployed Monitoring Suite
Section titled “Using an Independently Deployed Monitoring Suite”Both the data plane and control plane components of Higress expose a series of metrics through their APIs. You can monitor Higress’s internal operations by configuring Prometheus to collect these metrics and setting up dashboards in Grafana.
To get started, open Higress Console in your browser and navigate to the “Monitoring Dashboard” page in the left navigation menu. If the built-in monitoring suite isn’t installed, the page will display an external dashboard URL configuration page along with setup instructions for external systems.
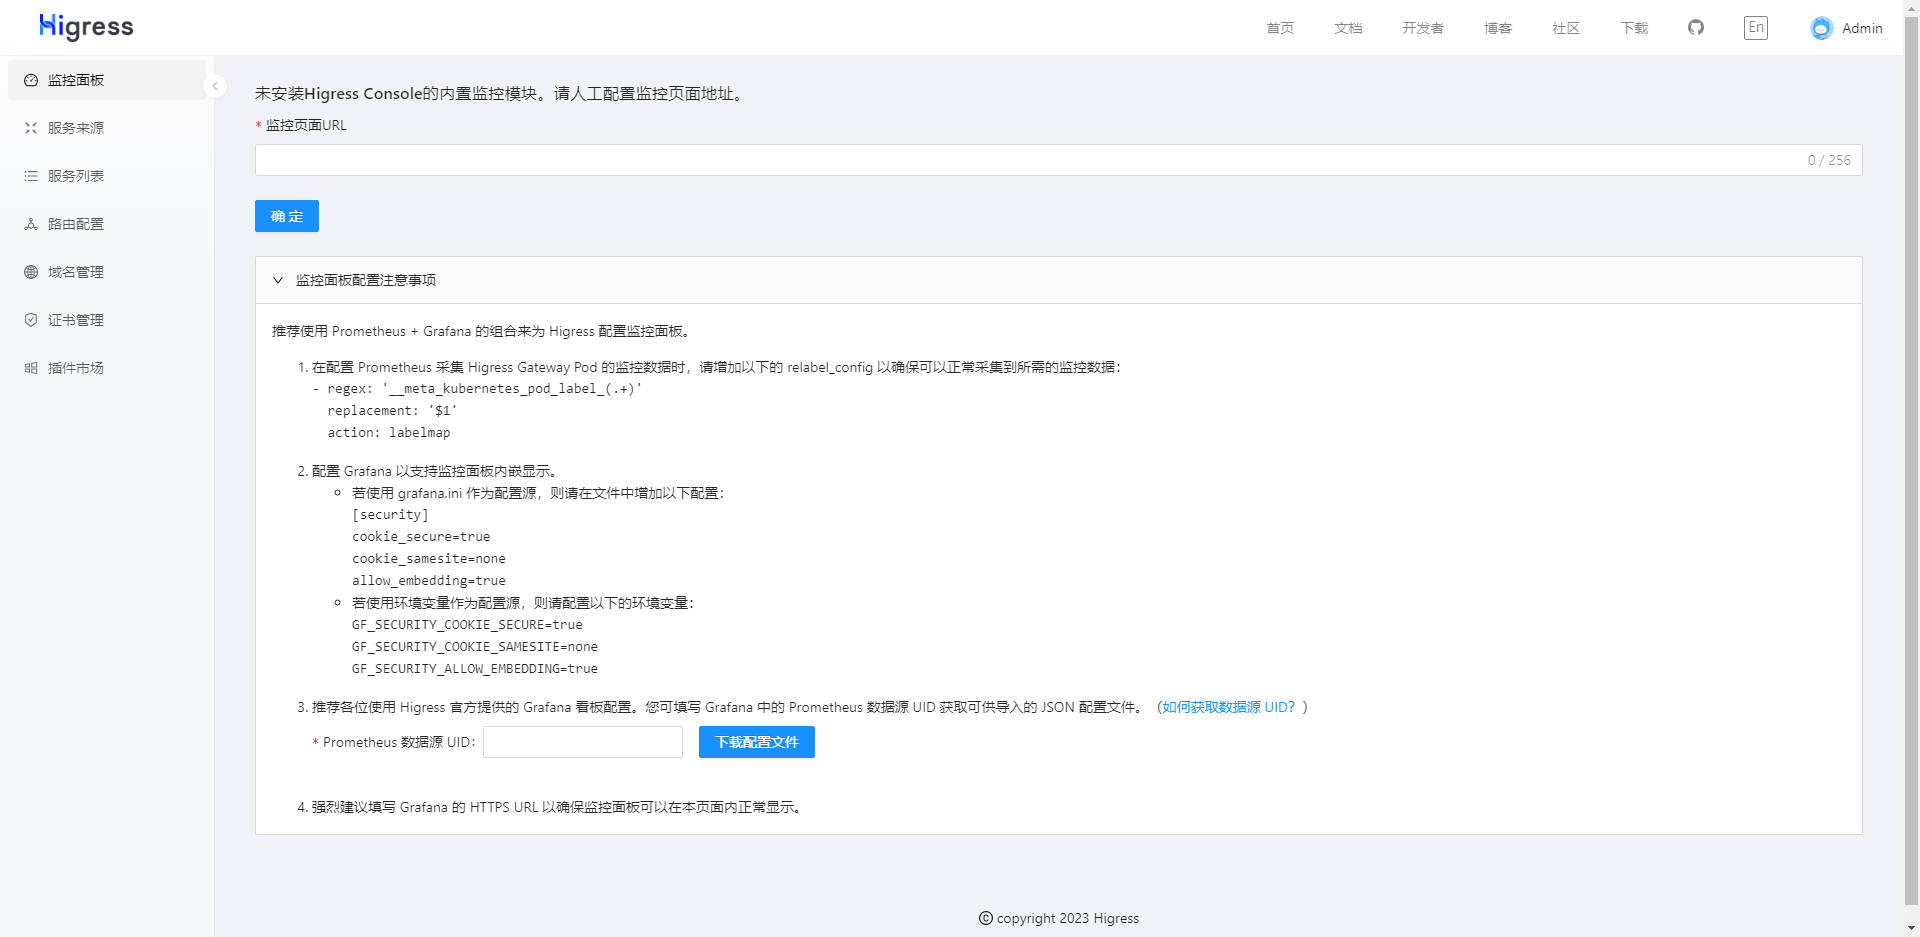
Follow the instructions at the bottom of the page to update your Prometheus and Grafana configurations. Then, enter the URL of your Grafana dashboard in the input field at the top and save. The page will refresh automatically, and the configured external monitoring dashboard will appear on the right side.
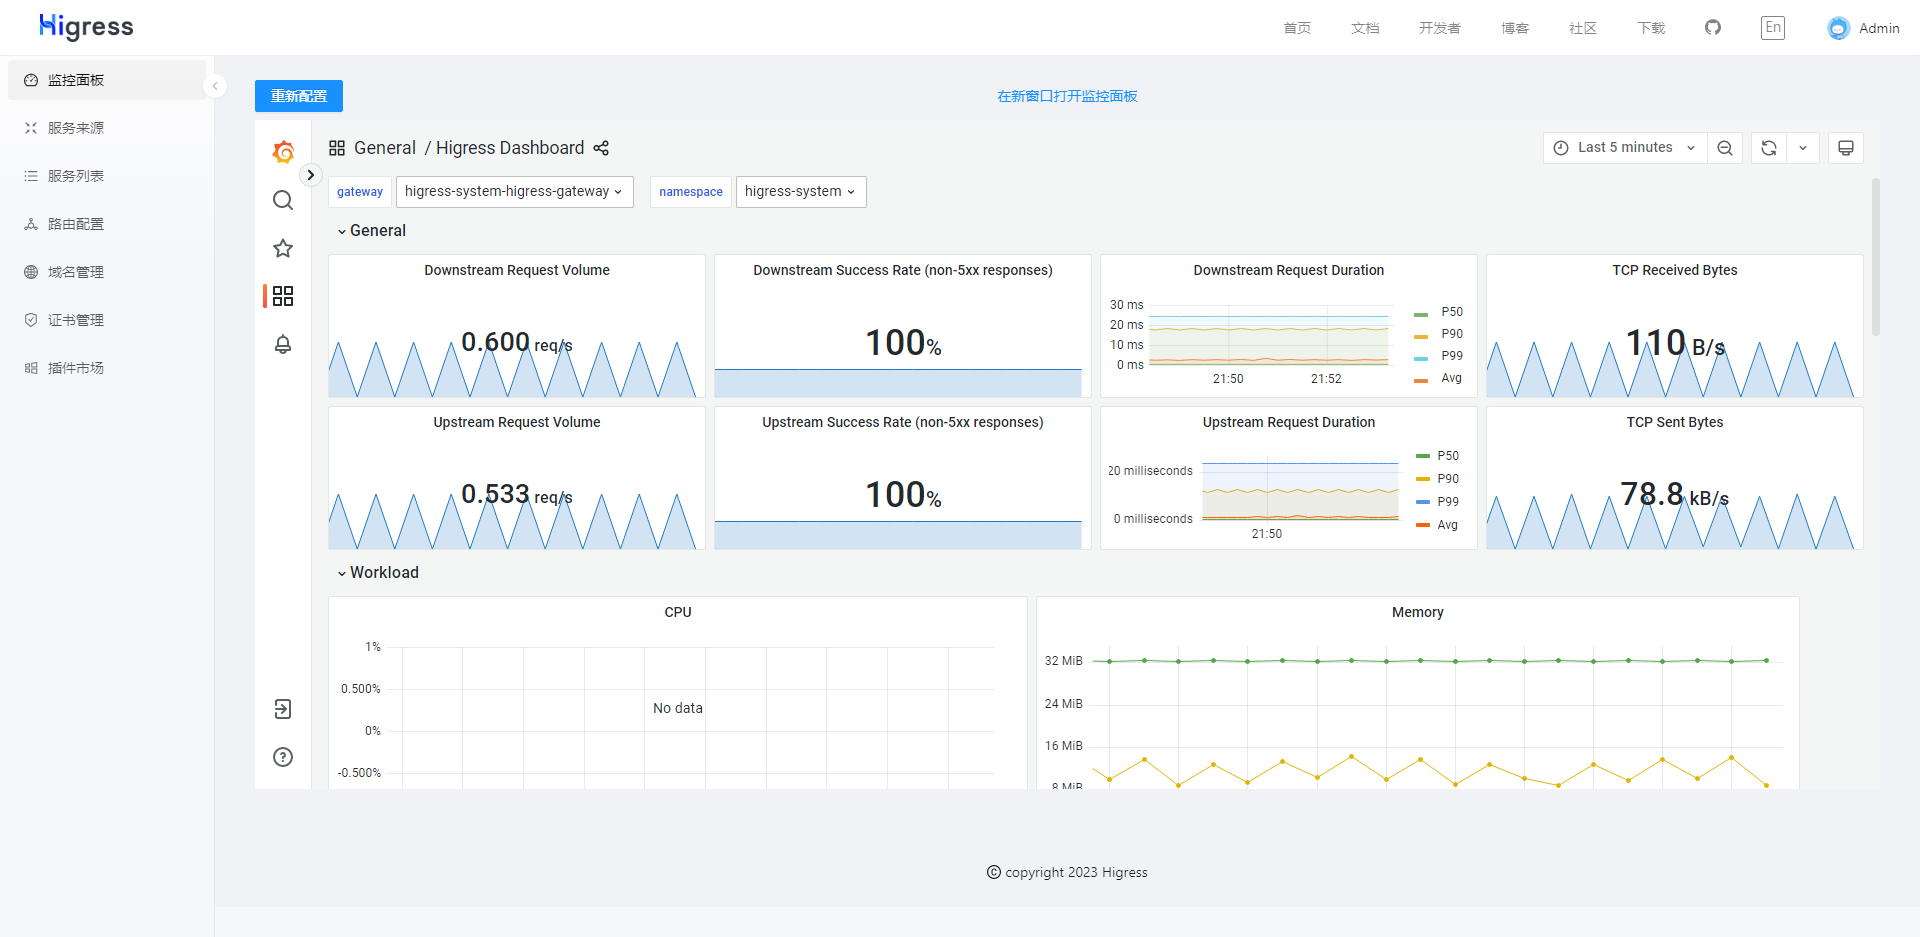
To update the monitoring dashboard URL later, simply click the “Reconfigure” button in the top-left corner of the page.